Store Demand Prediction using Machine Learning

Demand prediction/forecasting is the practice of estimating the amount of goods required to meet customer demand over a period of time. By implementing a demand prediction system, a business can make appropriate plans to face challenges they might encounter in the future market and take necessary actions in advance.
For fashion store to be able to sell products to customers, there is a long preparatory process which includes planning, vendor procurement, transport, stock checking, etc. In the case where an item is out of stock, the store has to repeat the whole preparatory process which is very time-consuming. Hence, a good stock prediction mechanism at the start of each month is a more favorable approach. This reduces the chances of a desired item being out of stock which can cause a loss of opportunity in gaining revenue. Thus, demand prediction is a beneficial method that can be used to assist fashion stores in achieving their business goals.
Tools used
- Programming Language: Python
- Libraries: Matplotlib, Scikit-learn
Monthly vs Weekly Predictions (Approach)
Demand prediction can be done for a variety of timeframes. Here, monthly and weekly predictions are being tested and compared, with each of them having their advantages and disadvantages:

For now, the monthly method is being implemented for demand forecasting. However, in the future, I will consider a hybrid approach that combines both methods.
The Dataset
The dataset for demand prediction uses all online transactional data within a 6-kilometer radius around the store.

Models for Demand Prediction
Initially, univariate time series models such as Prophet, Darts, Sktime were used to predict demand. However, the results were not good enough due to insufficient data points (only 3–4 years of data). This approach also required more model management since each item in each store is represented by one time-series model (in most stores, there are over 100+ items).

Machine learning models, such as Random Forest, XGBoost, and Light Gradient-Boosting Machine (LBGM) were then tested where one model could be used for all stores. However, the results were still unsatisfactory. The same models were explored again, but with one model representing one store compared to when one model was used for all stores.
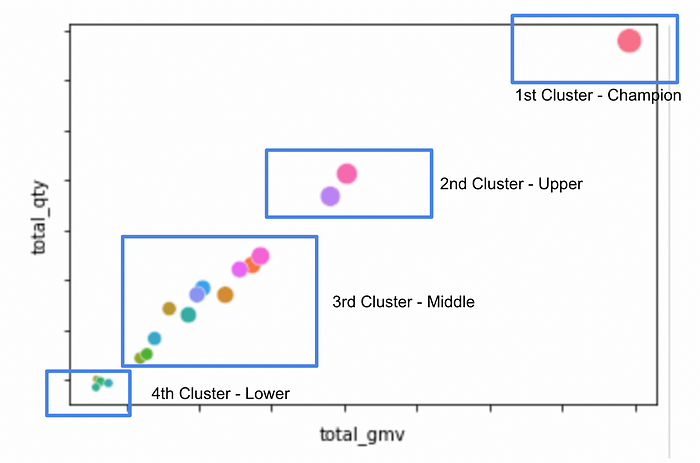
The results when using one model for one store showed an improvement. Nevertheless, managing the models for each store still proved to be quite challenging. Thus, an approach that uses clusters (one model for 3–8 stores) was used to overcome this problem. The clusters were chosen by analyzing the sales gross merchandise value (GMV) and the items being sold in each store. At the end of the trial, I found that Random Forest with multiple clusters in the configuration produced the best result.
Evaluation
Mean absolute percentage error (MAPE) is the method used to assess the accuracy of the demand prediction model. A larger MAPE value indicates a larger loss in sales opportunity.

Impact
Before using a machine learning model, I predicted demand manually using historical data, achieving a MAPE of 30–35%. After implementing the demand prediction model, I reduced the MAPE to 20–25%, which represents an improvement of approximately 29–33% when calculated using relative reduction. This improvement helps minimize sales opportunity losses by enabling better inventory management, reducing stockouts, and optimizing stock levels, ultimately contributing to increased business revenue. I am continuing to refine the model to further enhance its accuracy and reduce MAPE.
Limitations
However, there are still several limitations to this method that need to be addressed.
- The data used for this project is only aggregate transactional data, which does not yet include personalization, demography, and other factors that might affect these data.
- The data timeframe is limited to 3–4 years’ worth of data points.
What’s Next?
Further improvements can still be made to build on the results of this project.
- Combining weekly and monthly predictions can further enhance the results as demand can be monitored more frequently and any trends can be picked up quickly while ensuring that the workload for the operations team is manageable.
- Region and demography parameters should also be added to the model so that they can be considered when analyzing transactional data.
